Low Carbon Concrete Technologies
Understanding & Implementation
Authors
Aurelia F. Hibbert
Jonathan M. Cullen
Michal P. Drewniok
Published
01/03/2022
Key Points
Up to 37% of current cement industry emissions can be mitigated, compared to an OPC baseline, through the use of technologies with a high level of commercial readiness, against a 100% OPC baseline.
These technologies can be deployed at scale almost immediately, with policy encouraging or requiring their use.
Longer-term development of high-potential technologies across all lifecycle stages could unlock emissions reduction of up to 93%, compared to an OPC baseline, if these technologies prove to be viable at scale.
Development should focus on those technologies with medium to high commercial readiness that can be used in combination with each other, rather than competing against other technologies. The technologies identified are spread across the full lifecycle of cement production, use and disposal, so their implementation is influenced by a range of stakeholder groups, rather than being the responsibility of just one actor.
Across the high-potential technologies, three barriers to wide-spread adoption were found to be common:
- Regulation through Policy
Key Implementer: Government - Industry Skills
Key Implementers: Industry Bodies, Educators - Market Opportunities
Key Implementers: Market-leading Contractors and Clients
Specific mechanisms for addressing these barriers are discussed under three overarching recommendations:
- Introduction of policy that explicitly encourages or requires use of LCCTs
- LCCTs education as part of industry training and certification
- Creation of market-pull conditions for LCCTs
The need to reduce concrete emissions
Globally, concrete is the most consumed man-made material by weight.
In the UK, the production of cement and concrete is responsible for around 1.5% of national greenhouse gas emissions.
Decarbonisation of the cement industry is necessary under the UK’s Sixth Carbon Budget by 2040. This means that the industry needs to quickly mobilise existing emissions reduction potential and set out priorities for unlocking further potential through targeted development. Existing UK rely heavily of technologies that are not commercially ready yet, such as Carbon Capture, Utilisation and Storage (CCUS).
Cement and concrete is identified as a hard to decarbonise sector, as around 50% of the emissions arise from the fundamental chemical reaction required to create clinker, the main constituent of Ordinary Portland Cement (OPC). This means that emissions reductions techniques, such as alternative fuels and energy efficiency can only impact about half of the industry’s emissions.
The current understanding of sector emissions and decarbonisation pathways is limited to high-level analysis typically focussing on decarbonising existing manufacturing practices of OPC rather than the whole lifecycle.
Top-down and bottom-up analyses so far have failed to bridge the gap of where policy and investment effort should be focussed to start delivering the high impact, low barrier technologies.
To reach its targets, the UK needs to change by either dramatically reducing cement and concrete use or reducing the emissions intensity of these products.
Creating baselines for the uk concrete industry
Figure 1 presents the current state of the UK concrete industry, showing the breakdown of the industry emissions. This is used to ascertain how much of the industry emissions a technology can be applied to.
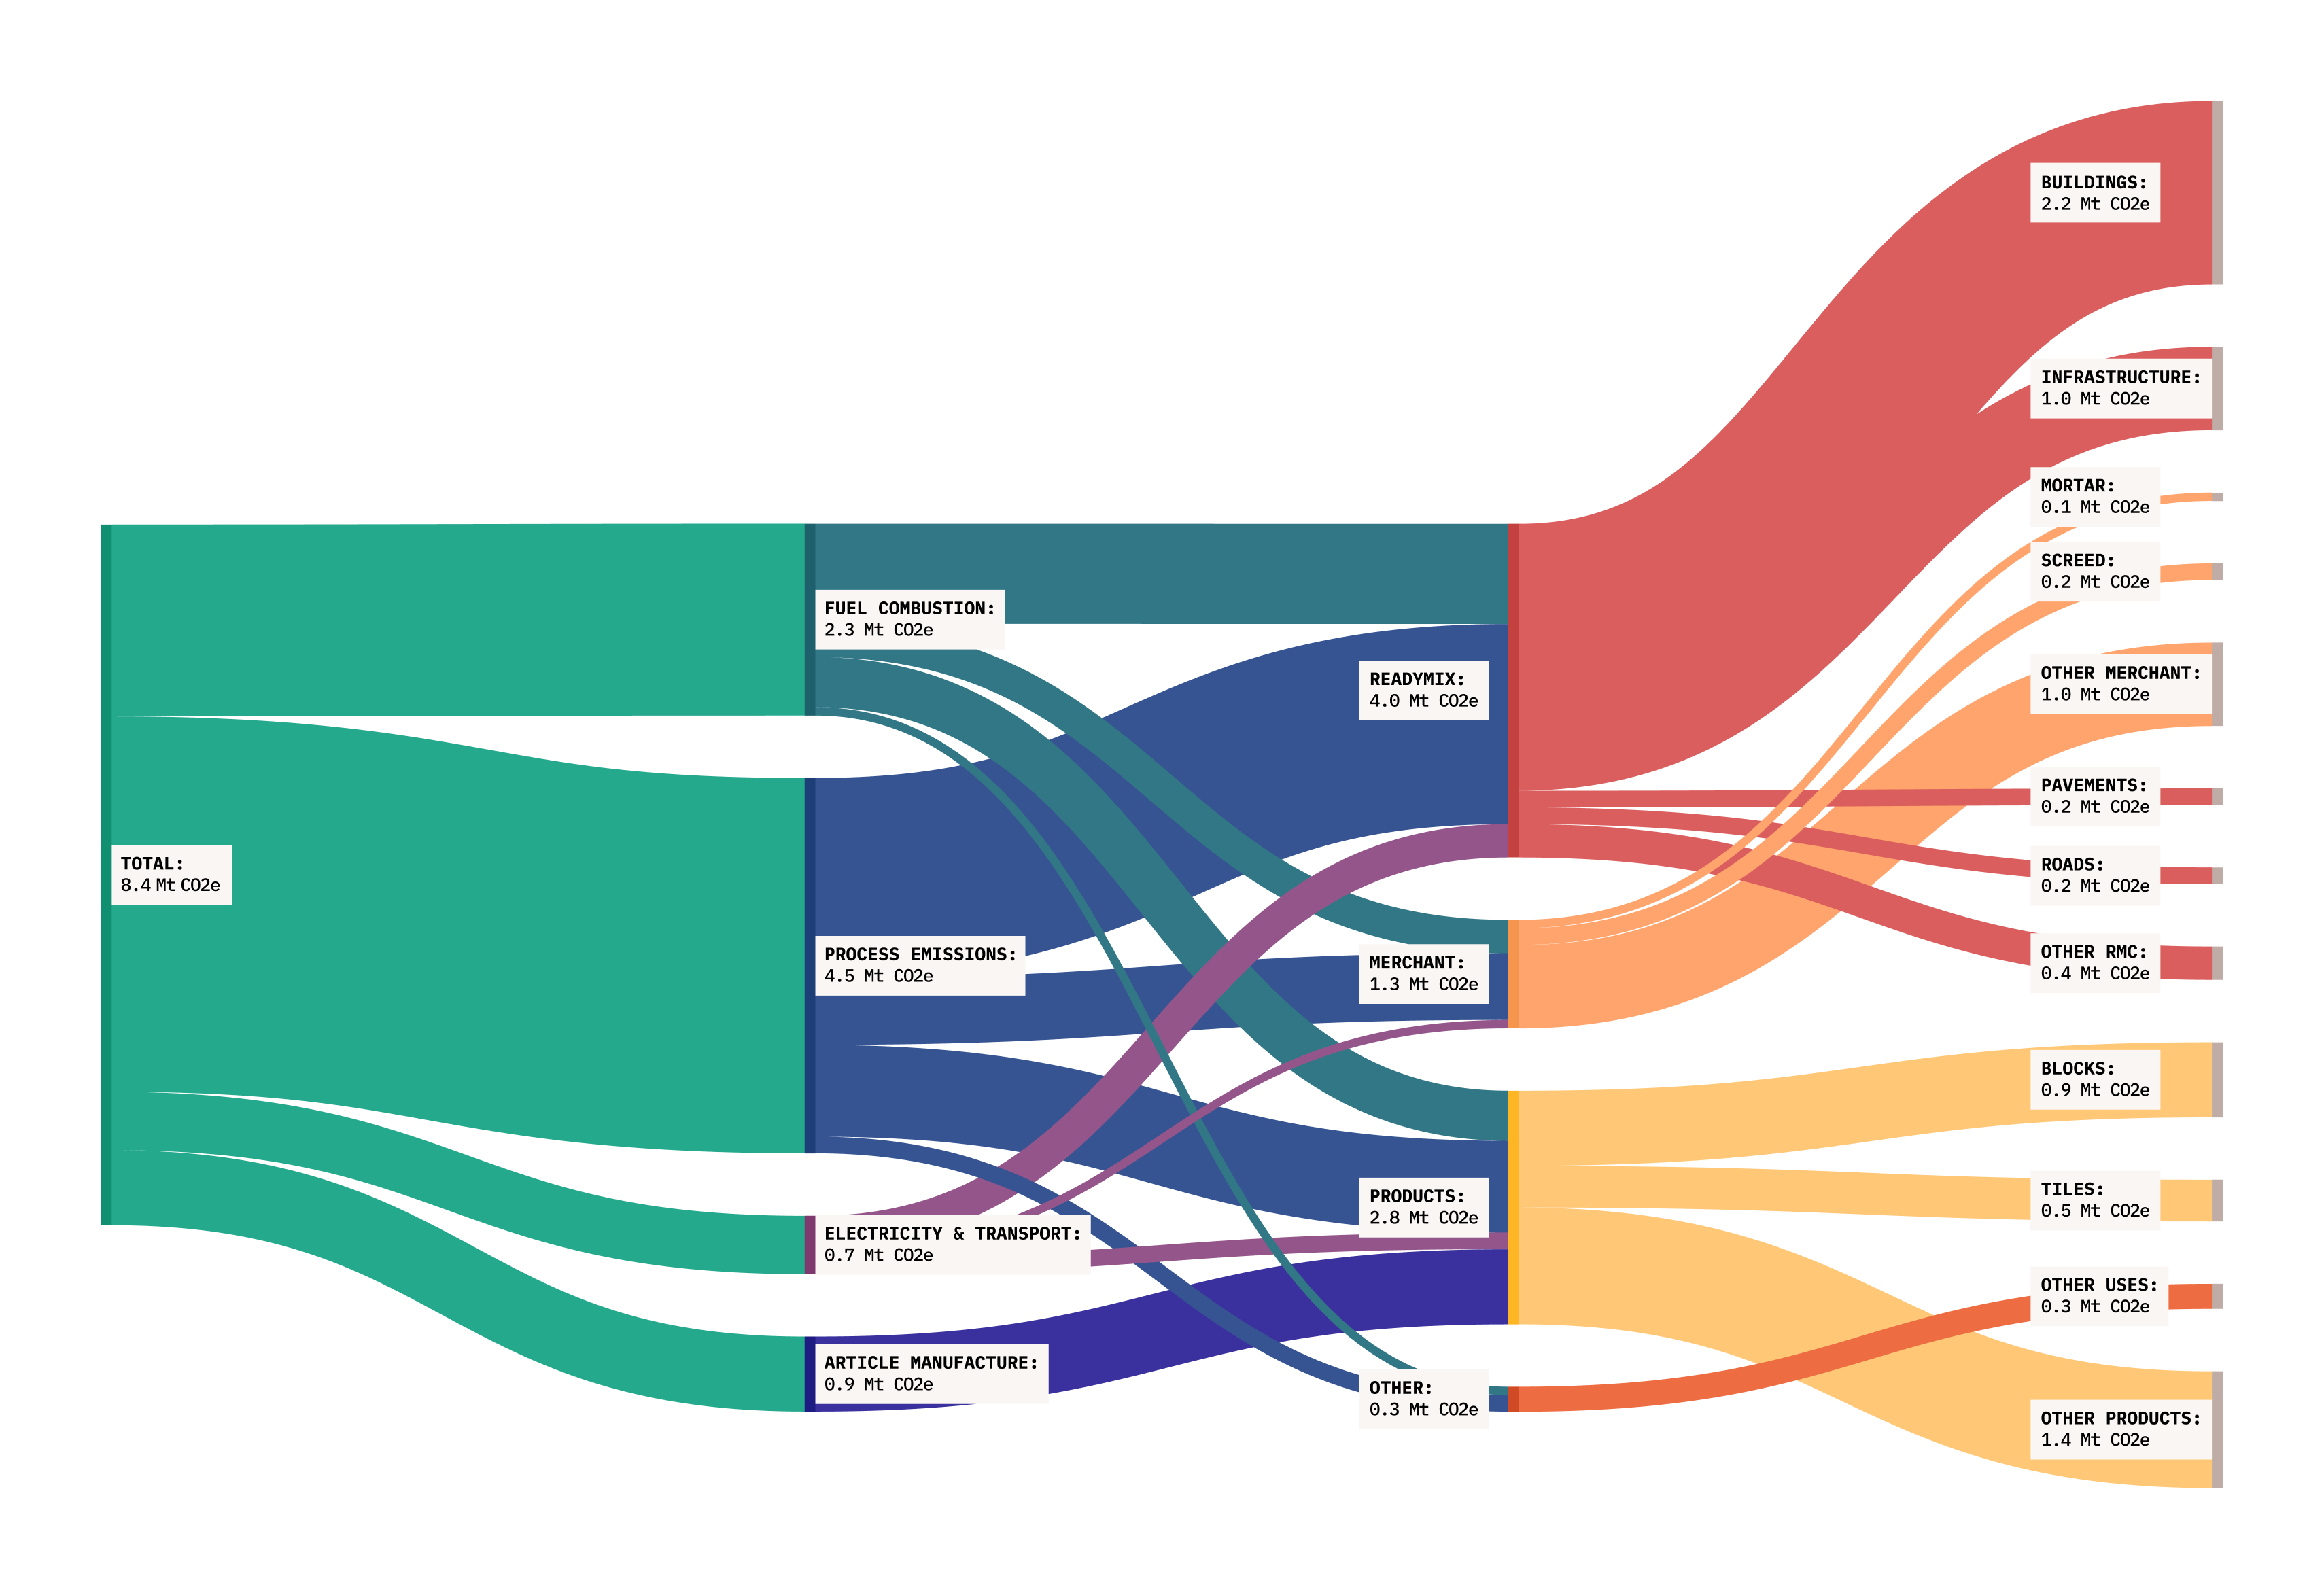
Figure 1: Breakdown of UK cement sector emissions by varying categories. Each column totals 8.4Mt CO2e, the total industry emissions.
Assessing the mitigation potential of LCCT
Technology Mapping
Technology mapping enables all LCCTs to be seen as a comprehensive set and the inter-dependencies of each to be better understood. By understanding where in the cementitious product lifecycle each LCCT sits, it is possible to investigate the stakeholders that can influence their implementation and propose how they can be combined in a holistic emissions reduction package.
LCCTs through the cementitious lifecycle
This study identified 75 different technologies from across all life stages of cement and concrete production, which might be applied in the UK context.
The technologies are categorised based on the lifecycle stage at which they are applied. The lifecycle stages used in the mapping exercise are shown in figure 2. Figure 2 also indicates the main stakeholders that can undertake or influence the use of LCCTs at each stage. Without engagement with all stakeholders, significant emissions reductions will be extremely difficult to achieve.
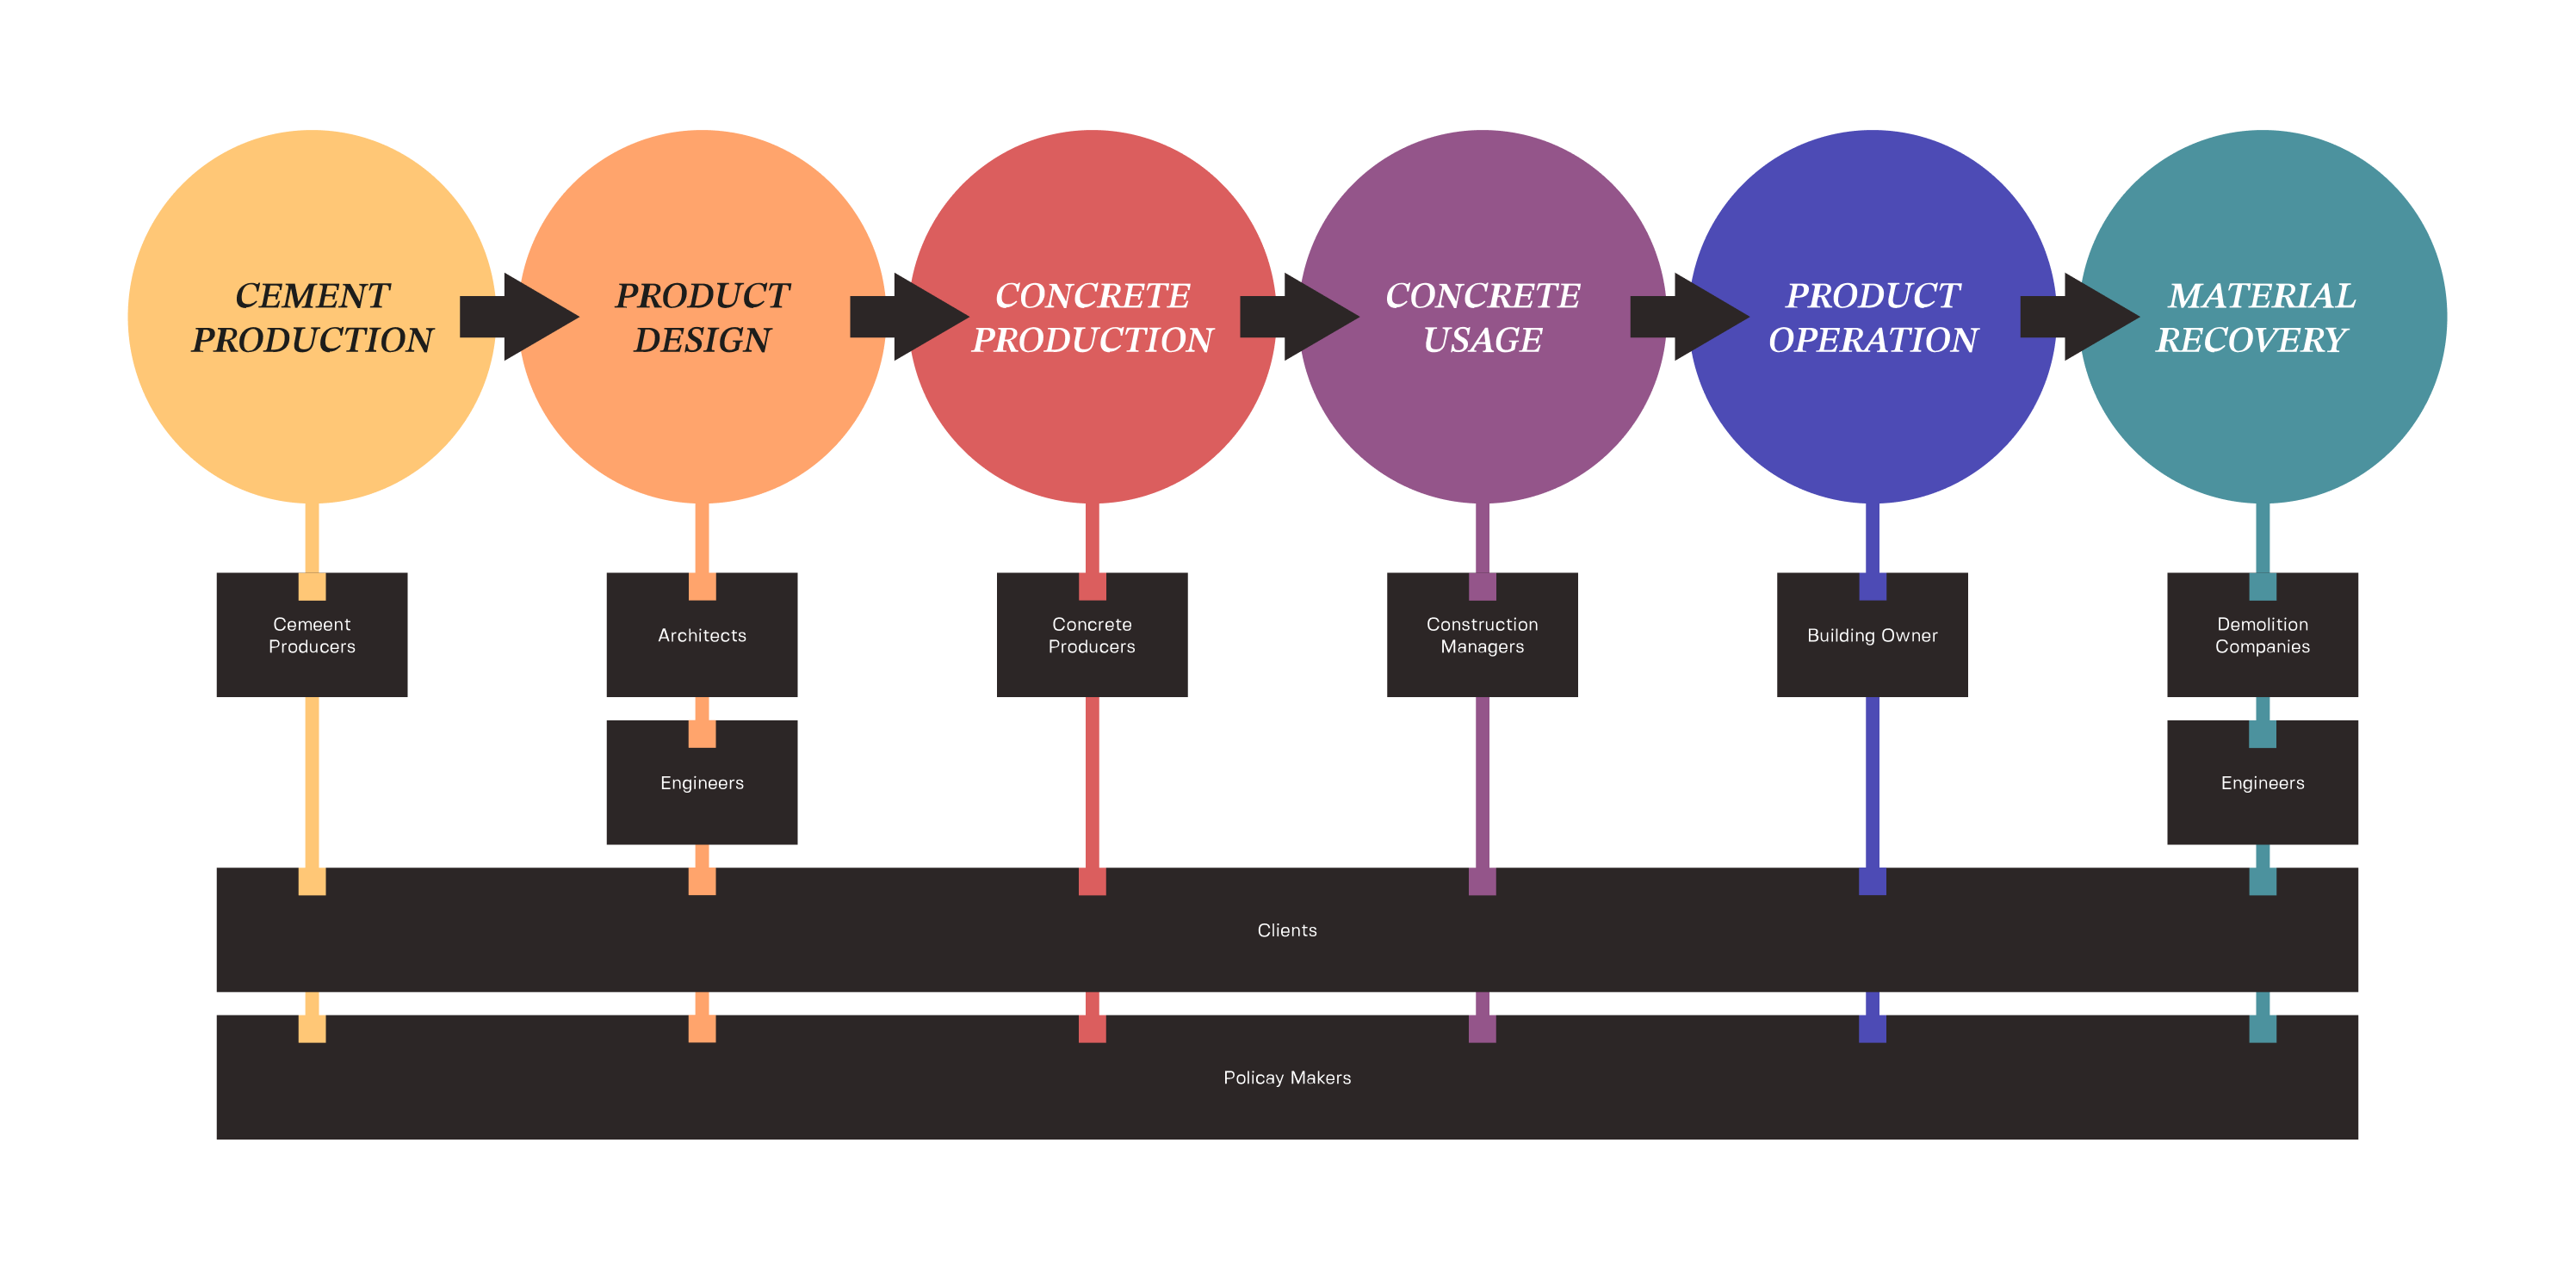
Figure 2: The lifecycle stages of concrete products and key stakeholders with LCCT influence.
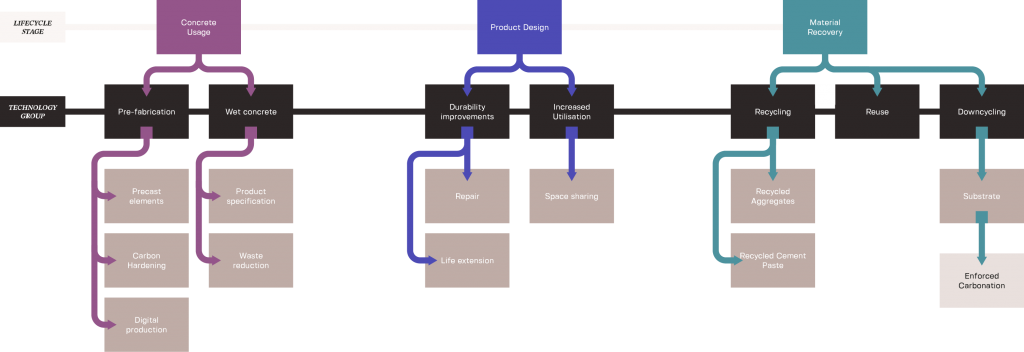
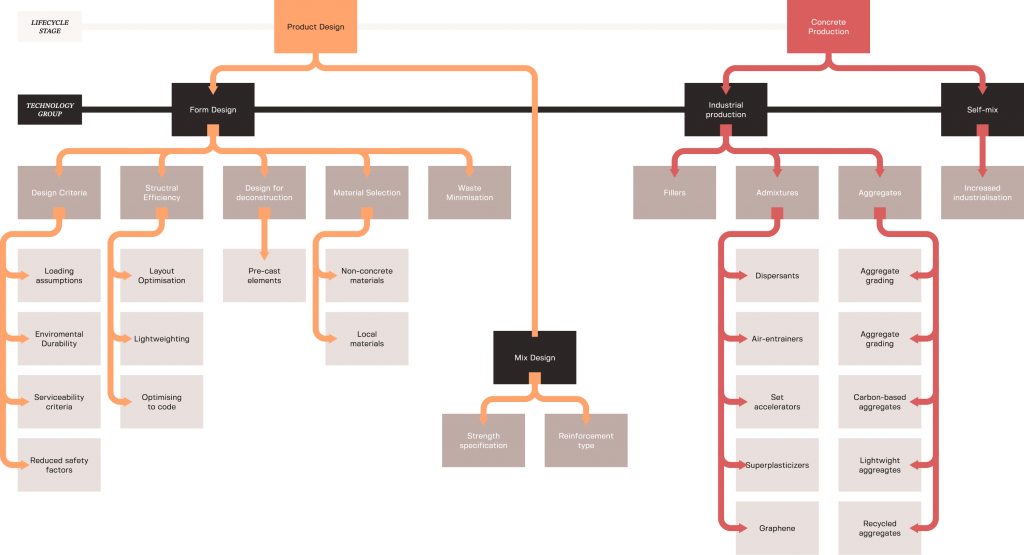
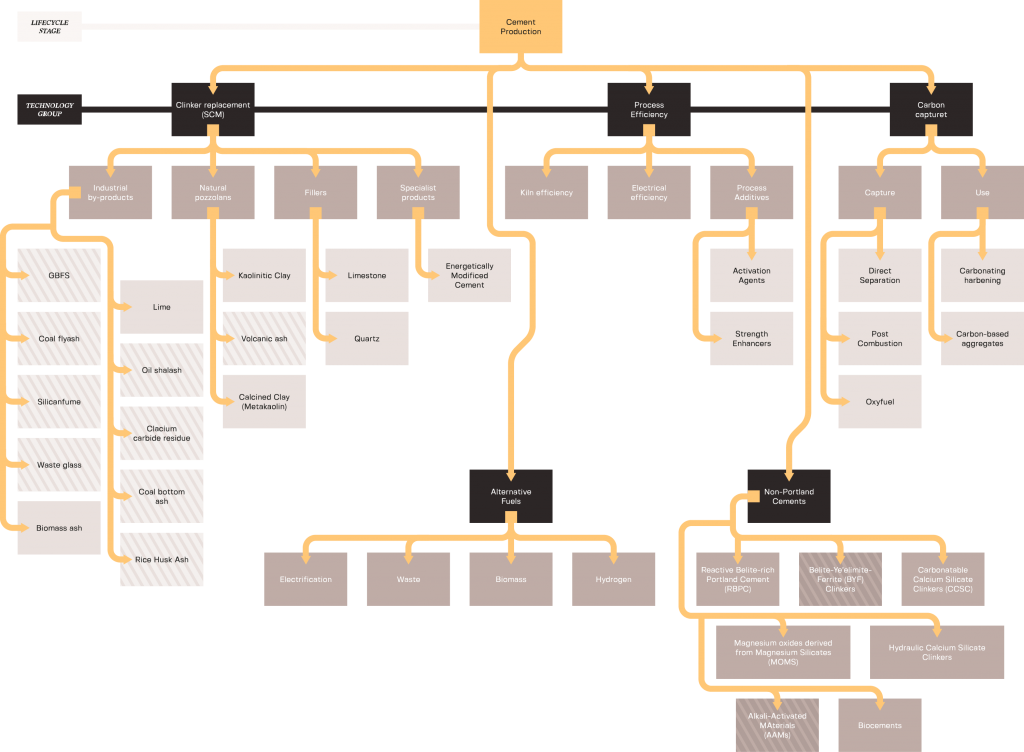
The full map of all 75 LCCTs is shown in figure 3.
Figure 3: Map of low carbon concrete technologies and processes, arranged by lifecycle stage.

It is important to filter the full list of technologies for those that can unlock the most additional carbon savings and to rule out low-impact technologies from industry priorities.
The upper bound potential emissions reductions (i.e., compared to an OPC baseline) for the studied technologies (where data was available), are plotted in figure 4.
LCCTs with a potential industry saving greater than 10% of UK cement and concrete related GHG emissions are considered to be high potential technologies as their development and uptake could result in significant savings for the industry. This analysis found 18 technologies with a potential industry emissions reduction of 10% or more.
Figure 4: Potential emissions reductions available in the UK through the widespread use of the technologies studied. Technologies are arranged in order of UK potential savings within their mapping category.
Barriers to implementation of LCCT in UK industry
Some high-potential technologies and processes are deployable today, so understanding why they have not achieved widespread adoption is key for defining how the industry can unlock these potential emissions reductions.
While some LCCTs are being supported by demonstration plants, the Innovation Readiness in UK Foundation Industries report identified the following key barriers to innovation across the foundation industries, including the cement industry:
- High entry barriers and associated very low levels of churn (the rate of change of industry assets).
- Under-developed management and leadership skills.
- Dispositions and mindsets resistant to innovation.
- Widespread reluctance to collaborate.
- Regulatory and other pressures to achieve profound reductions in carbon emissions.
However, at an individual technology level, there are other factors at play as explored in this section. To identify the key barriers which restricted implementation of the high-potential technologies and processes, a modified Commercial Readiness Index is adopted rather than more standardly used Technology Readiness Levels (TRLs). A high TRL does not ensure a technology will reach commercialisation; many cement and concrete innovations at high TRLs commonly fail to reach commercialisation. For definitions of CRIs and TRLs, refer to the main LCCT report.
Technical performance is not sufficient to drive adoption of the technology itself; knowledge and skills, perceptions, proven technical performance, established standards and availability of materials are also key in determining the successful adoption of a technology.
The CRI and how it compares to TRL is shown in figure 5.
The resulting technology readiness map of high-potential technologies is shown in figure 6.
Figure 6 is set out such that each column is mutually exclusive. That is that any technology on the map can be combined to full deployment with a technology from another column, but not a technology within its own column.
Mapping the technologies in this way clearly shows that the majority of high-potential LCCTs are in the cement production life-cycle stage, with form design presenting the next largest group of high-potential LCCTs.
In addition, several technologies are at a CRI level of 6, suggesting they are ready for mainstream implementation. These technologies should be the focus of efforts for immediate emissions reductions in the industry and as such their remaining barriers should be addressed as a matter of urgency.
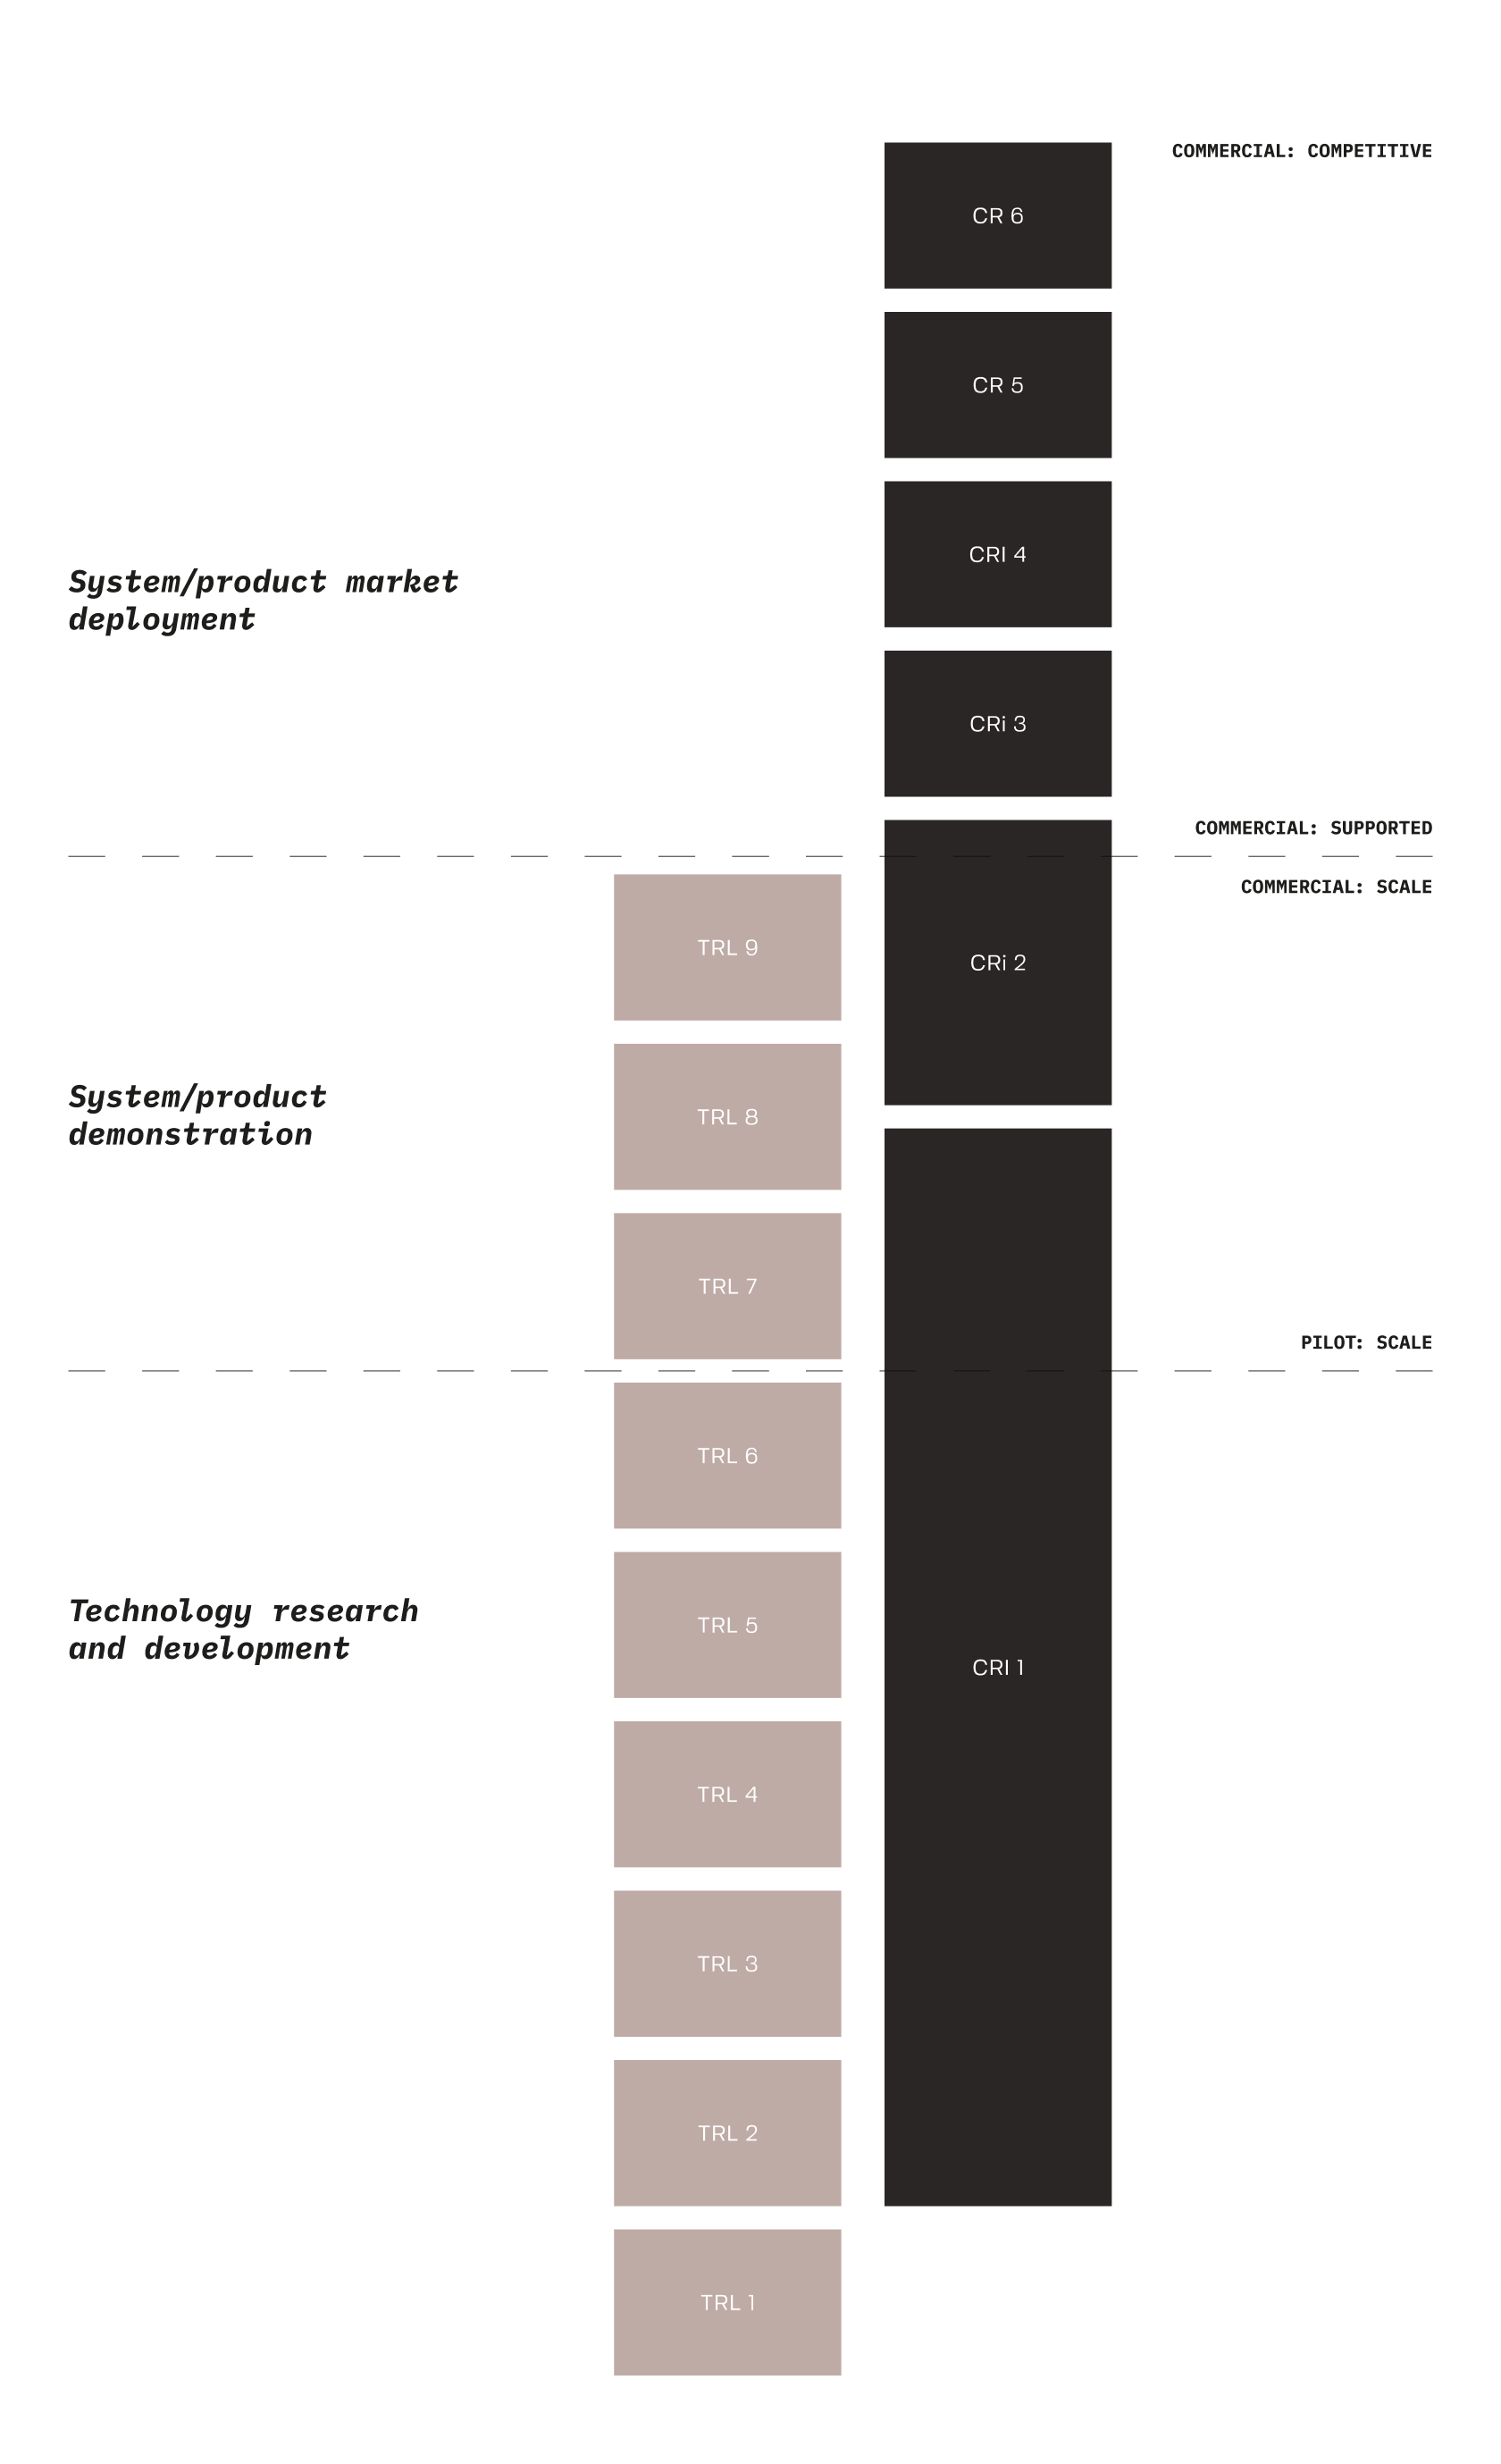
Figure 5: Assessment Framework for LCCT.
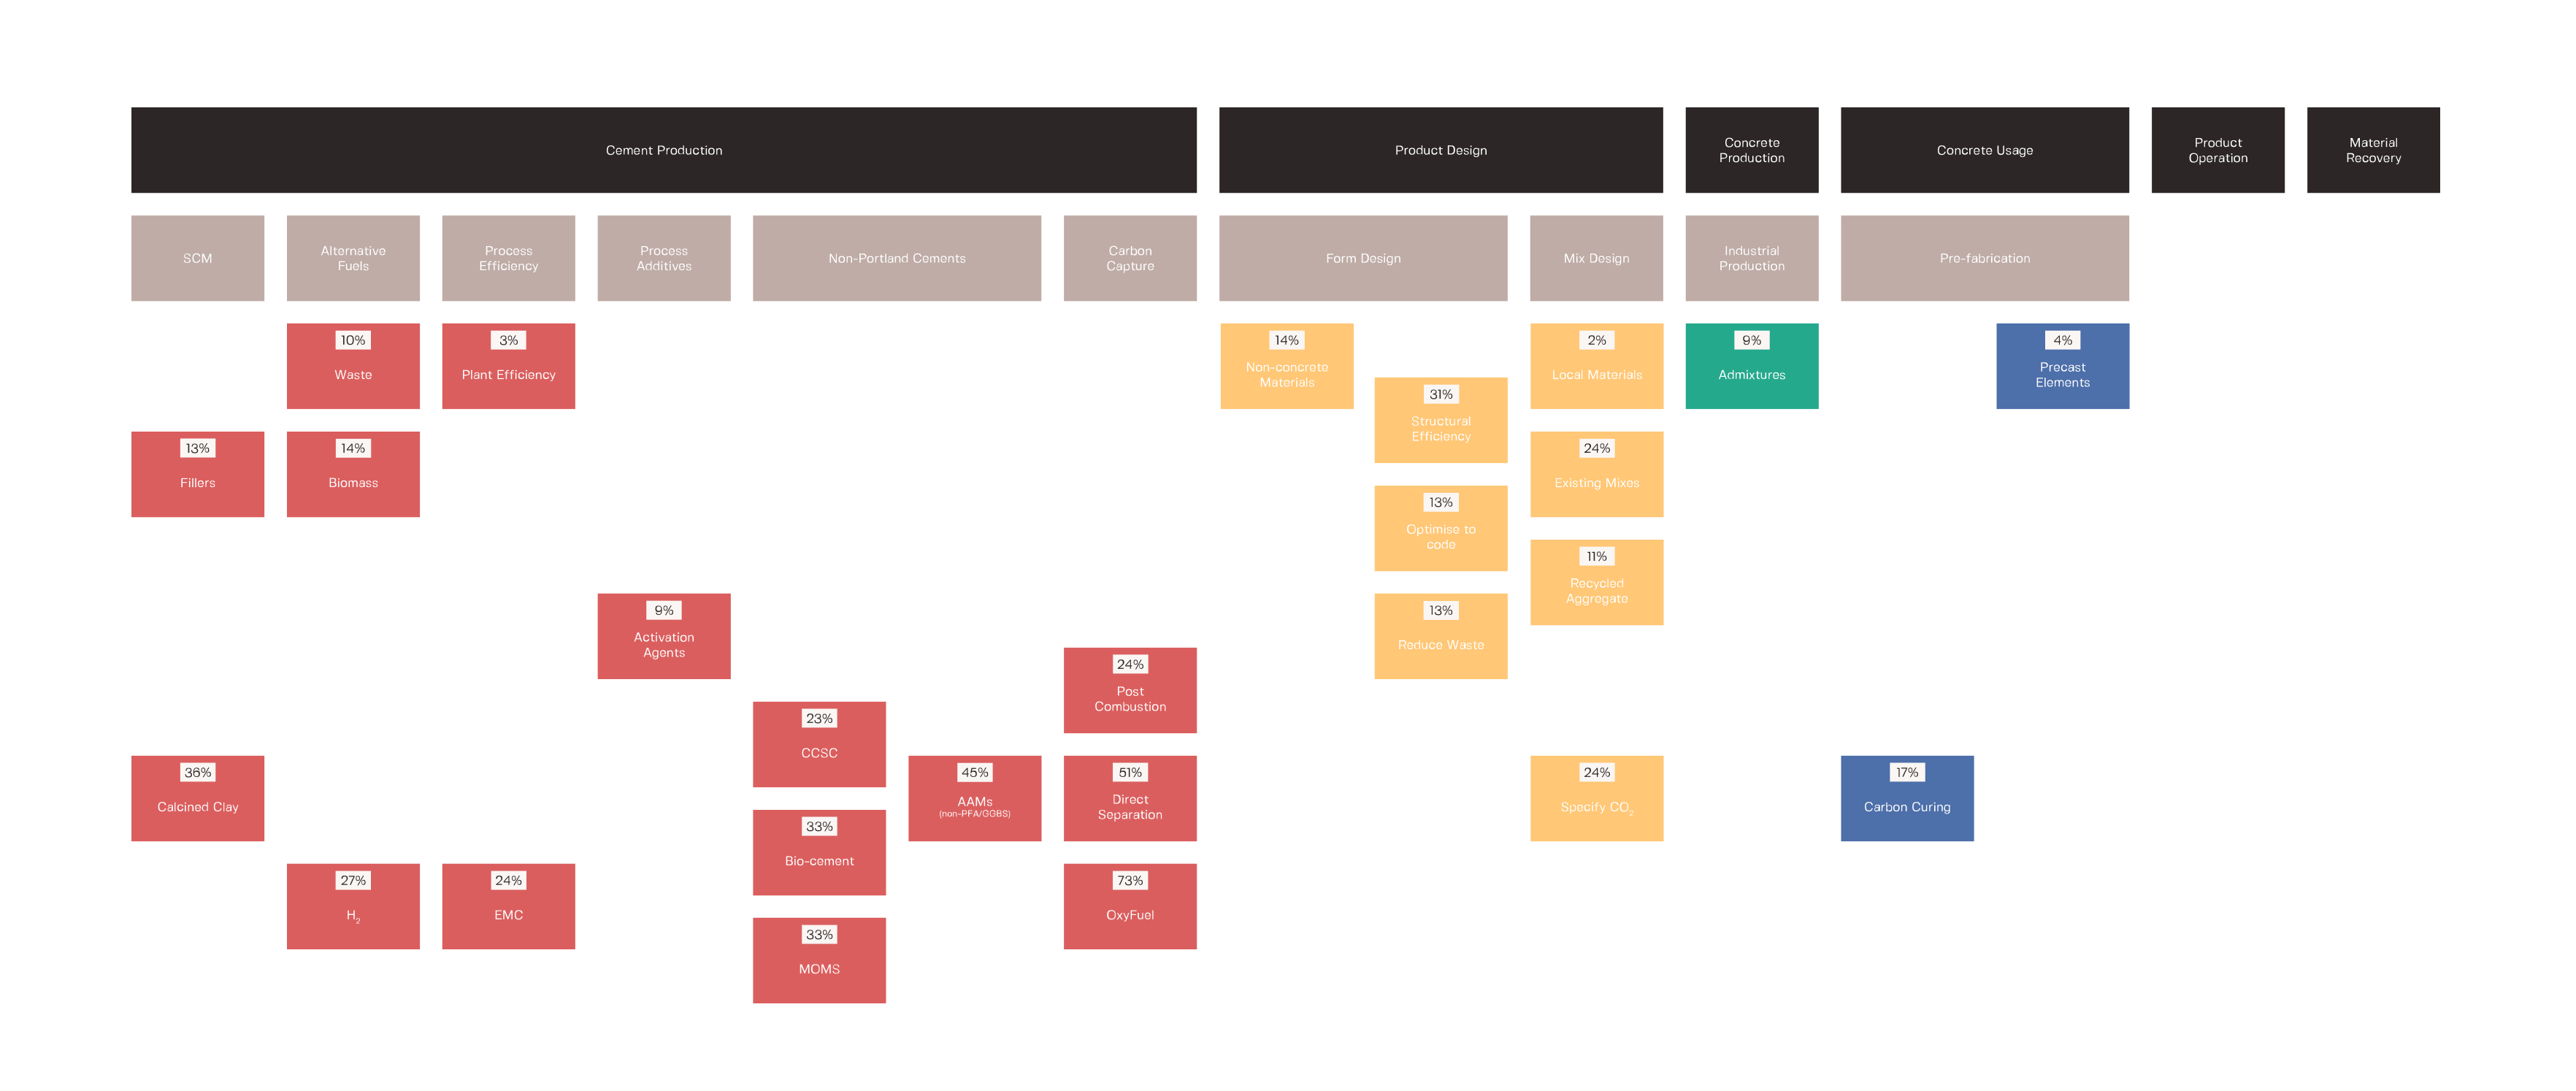
Figure 6: Low Carbon Concrete Technologies mapped by Commercial Readiness Index and upper bound UK industry emissions reduction potential. The technologies included in this map have either an upper bound UK industry potential emissions reduction of over 10% of total UK industry emissions or are assessed as having the highest level of commercial readiness (CRI 6 -Mainstream Deployment).
Assessing the mitigation potential of LCCT
All Technologies
All technologies with quantified upper bound emissions potential reduction (from figure 4), were assessed for their lagging indicators. These indicators are those that have a level lower than the modal value for the technology. The summary of lagging indicators across all assessed technologies are shown in figure 7.
When considering the assessed LCCTs the three lagging indicators that are most common are Regulation through Policy, Industry Skills and Market Opportunities.
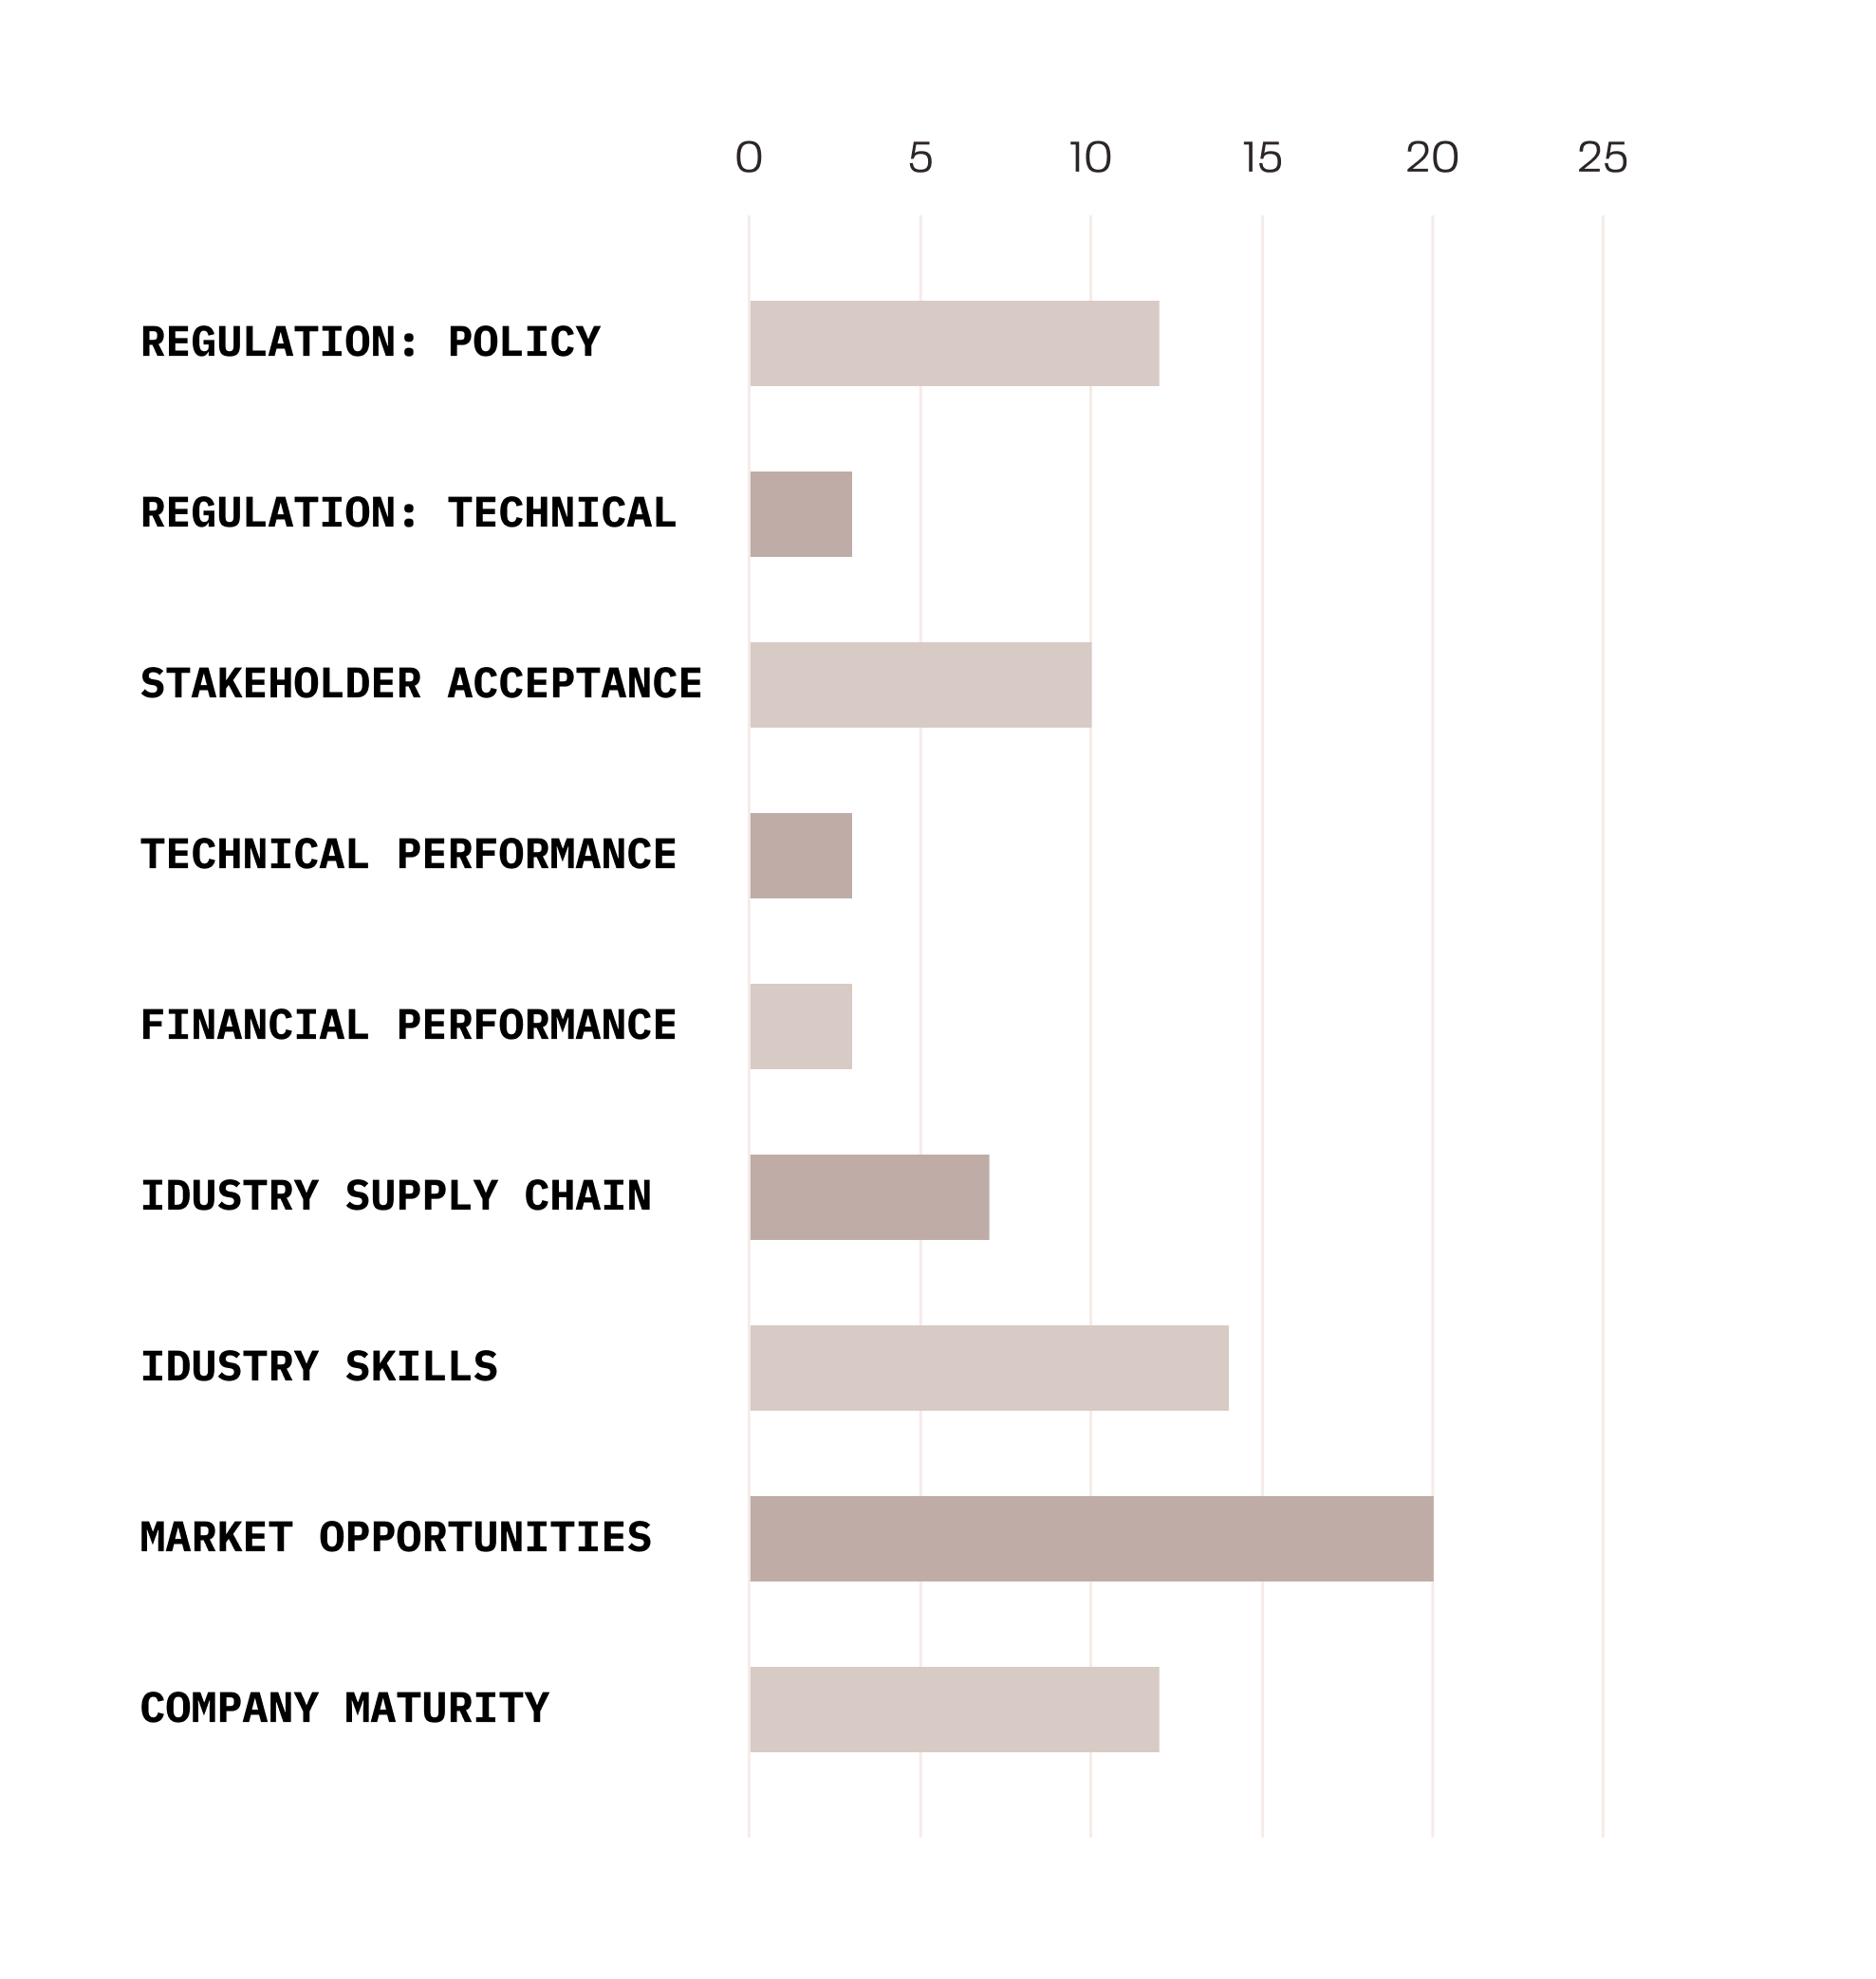
Figure 7: Frequency of lagging indicators for all technologies
High-Readiness Technologies
Looking more specifically at the technologies with a CRI of 6, the distribution of lagging indicators is different, as shown in figure 8.
These technologies, with the highest level of commercial readiness, have clear alignment that Regulation through Policy is a barrier. This is primarily showing that policy is not explicitly encouraging or requiring LCCTs to be used in relevant applications. This can be evidenced by the lack of embodied carbon considerations and requirements in existing AEC industry policy in the UK.
Other than policy, financial performance (both reliability and level of cost), industry skills and market opportunities are common lagging indicators for the high-readiness technologies. Here financial performance is different to the overall picture of lagging indicators, suggesting that the availability of cost data and multiple products using these high-readiness technologies are limiting their uptake to some extent.
However, as cost reductions and reliability can typically be achieved through scale of production and market competition, it is not surprising that financial performance can be a follower of mainstream implementation in some cases.
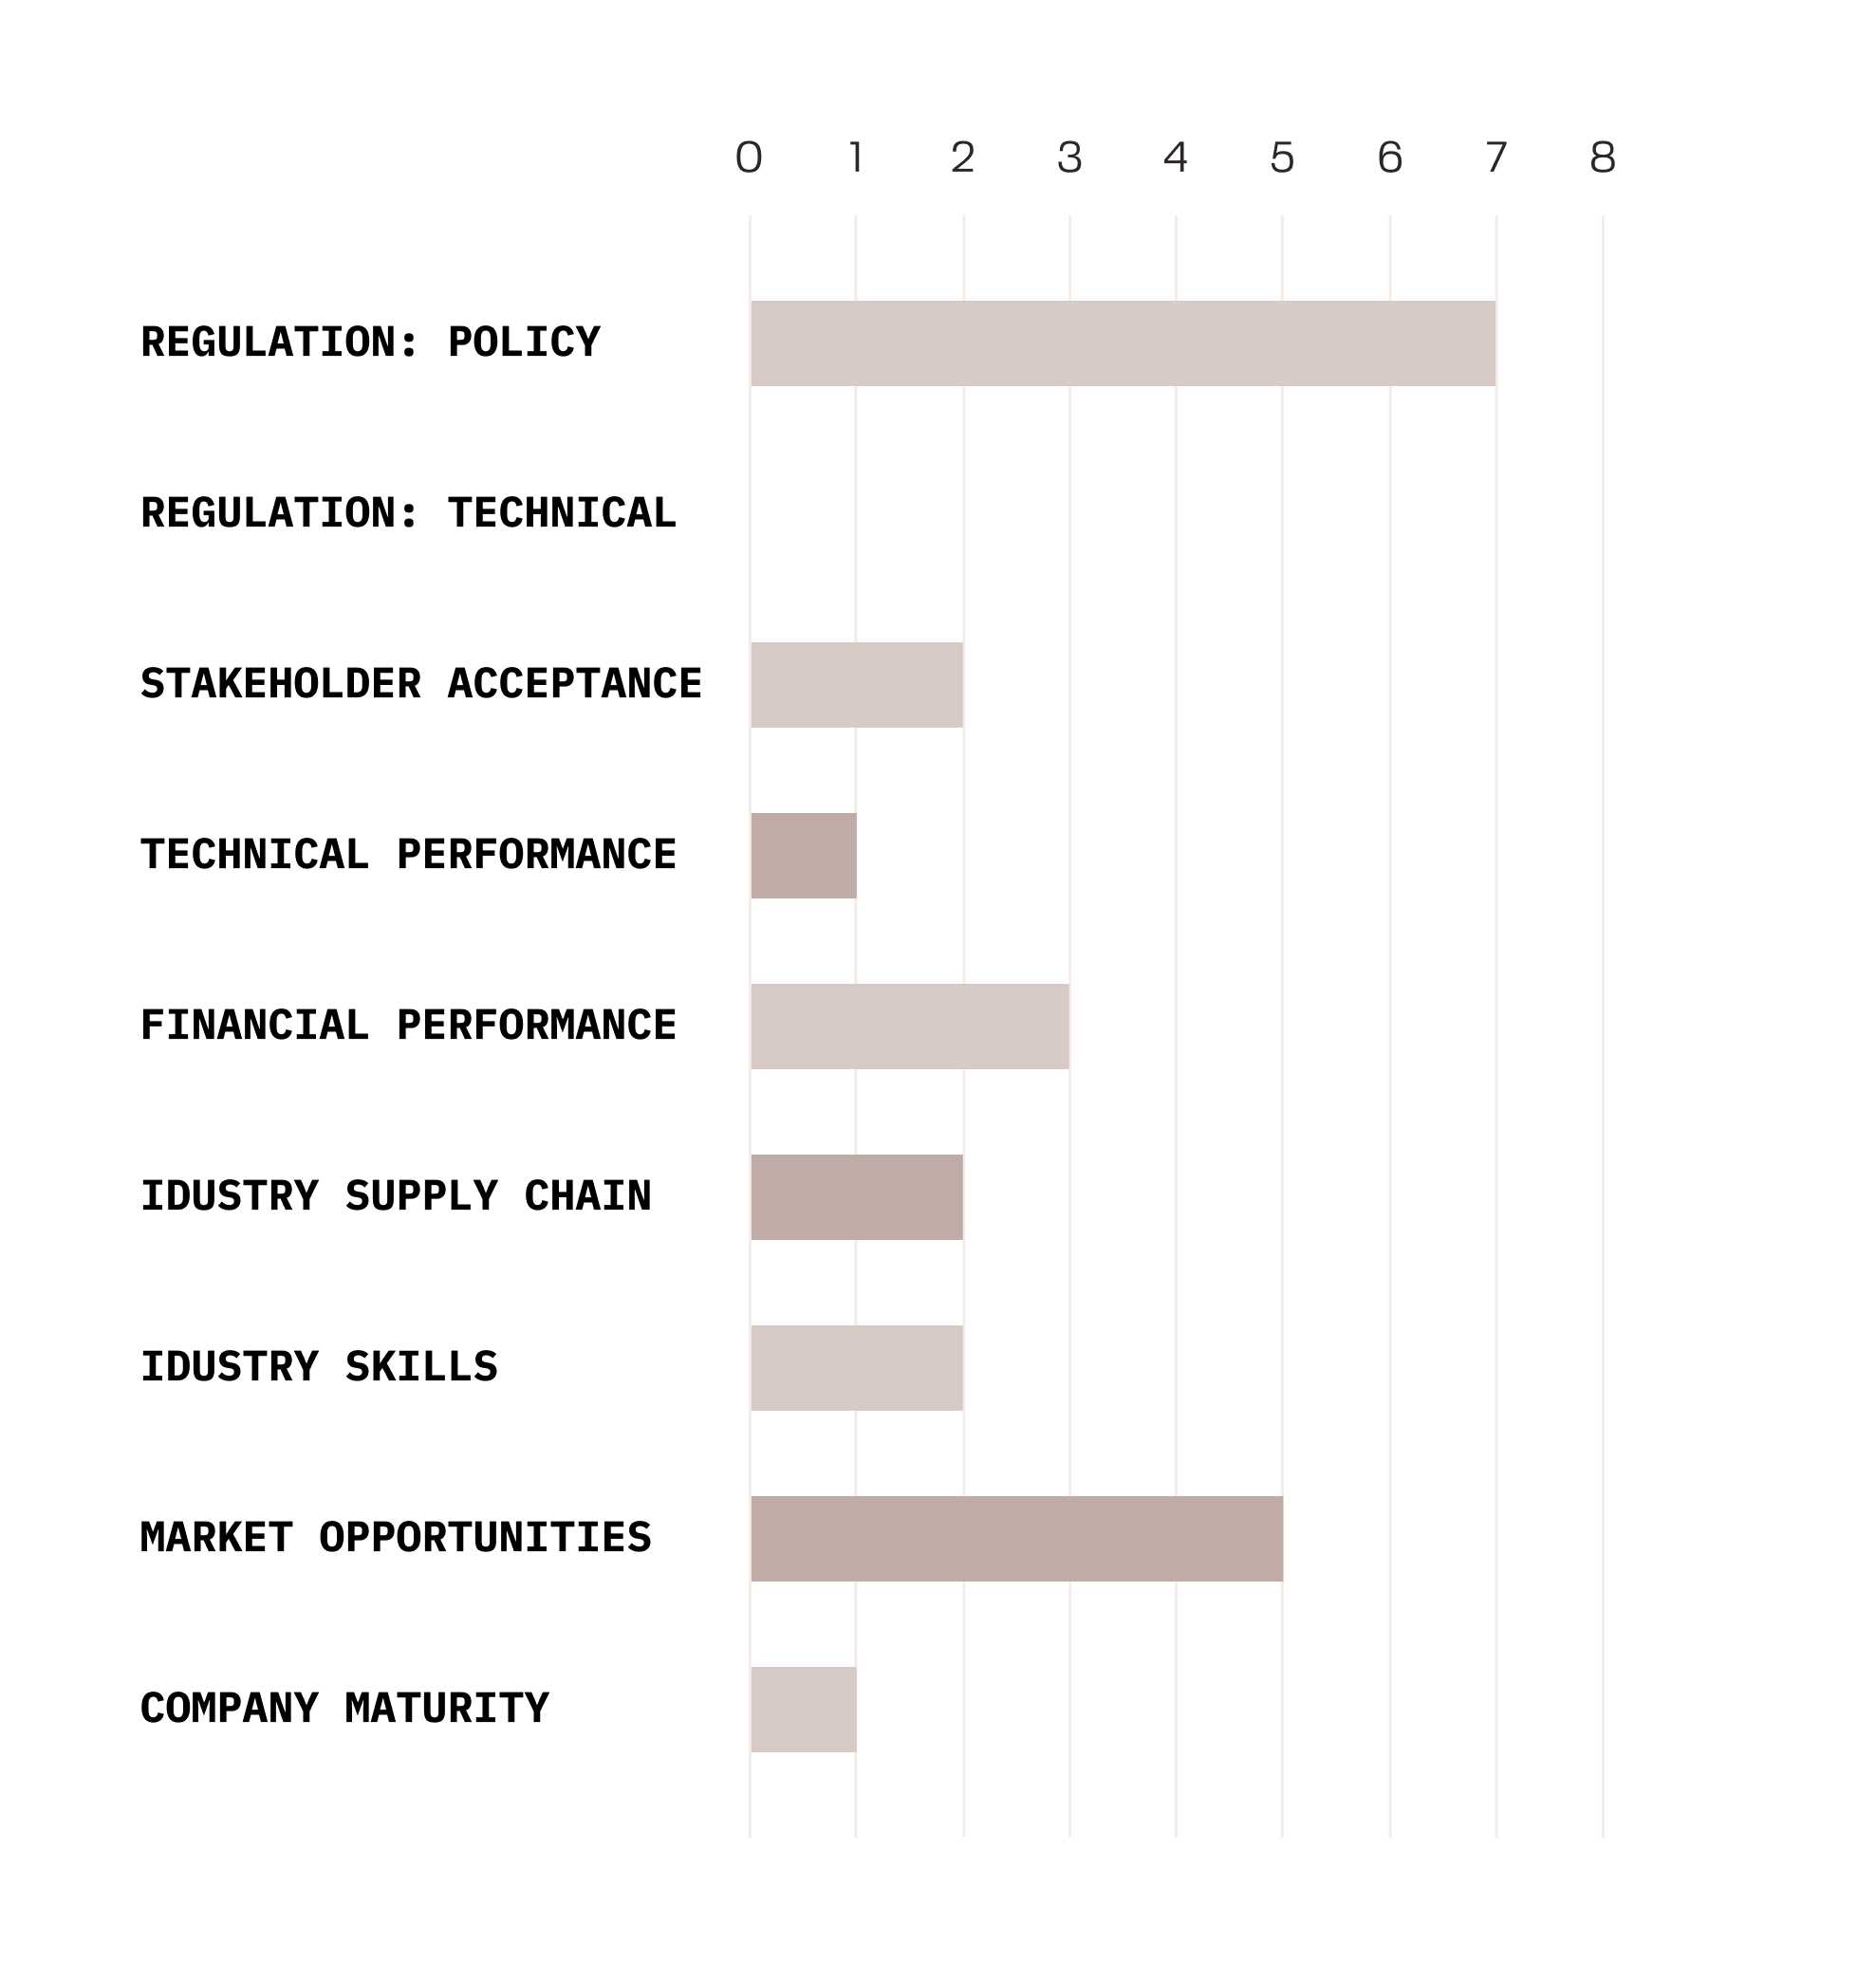
Figure 8: Lagging CRI indicators for LCCTs with a summary score of 6
Through assessing the commercial readiness of the technologies, using a modified Commercial Readiness Index, three key barriers were identified with several recommended actions to address these barriers.
Regulation through Policy
Develop policy that explicitly encourages or requires the use of LCCTs in relevant applications.
A precedent for this type of policy can be seen in the energy performance requirements for new buildings and as quantifying embodied carbon becomes increasingly advanced, similar measures could be implemented for concrete usage. Specific recommended actions include:
- Set maximum carbon emissions from combustion per unit of cement output
- Fund non-Portland cement production
- Demonstrate Post-combustion CCUS
- Include embodied carbon in building and infrastructure regulation
Industry Skills
Require education around LCCTs as part of industry training and certification.
As Health and Safety training has been incorporated into industry certifications and internal organisational requirements, similarly education around LCCTs and their application could be incorporated into the formal training of individuals. Specific recommended actions include:
- Clear messaging around LCCTs, including definitions
- Chartership requirements for LCCT knowledge
- Apprenticeships and higher-education to include LCCT usage
Industry Skills
Create market-pull conditions for LCCTs to expand opportunities beyond technology-push channels.
Market leaders wield significant power in changing industry attitudes and creating large-scale demand for certain technologies and projects. By uniformly adopting LCCTs across all applicable projects, market leaders at all stages of the cementitious lifecycle can develop market opportunities and accelerate penetration of LCCTs. Specific recommended actions include:
- Market-leaders setting embodied carbon targets
- Procurement policies that favour LCCTs
These actions sit across most lifecycle stages of cementitious materials and products and as such can be implemented by a range of stakeholders. This ensures that responsibility for decarbonising the sector does not rest with a single stakeholder group but requires cooperation between stakeholder groups to achieve meaningful outcomes.
Industry Perceptions
While analysis using a formal framework can provide a view on the state of different LCCTs, their adoption into industry also depends on industry’s perception of them. Perceived barriers may not align with actual barriers and are primarily overcome with education and knowledge sharing.
To calibrate the lagging indicators with industry experience, a short survey on the high-potential technologies was undertaken. This covered the technologies which have a savings potential of 10% or greater, and those with a CRI of 6.
Participants were asked to identify those of the CRI indicators that they consider to be the key barriers to each technology.
In total, 17 AEC industry professionals responded to the survey.
One of the most common responses to being asked what the key barriers are to each of the high-potential LCCTs was ‘Don’t Know’. This clearly indicates the low level of awareness around LCCTs and their state in the market. The least well understood technologies were in the cement production lifecycle.
The most common barriers identified by the respondents were Supply Chain, Industry Skills and Technical Standards, as shown in figure 9.
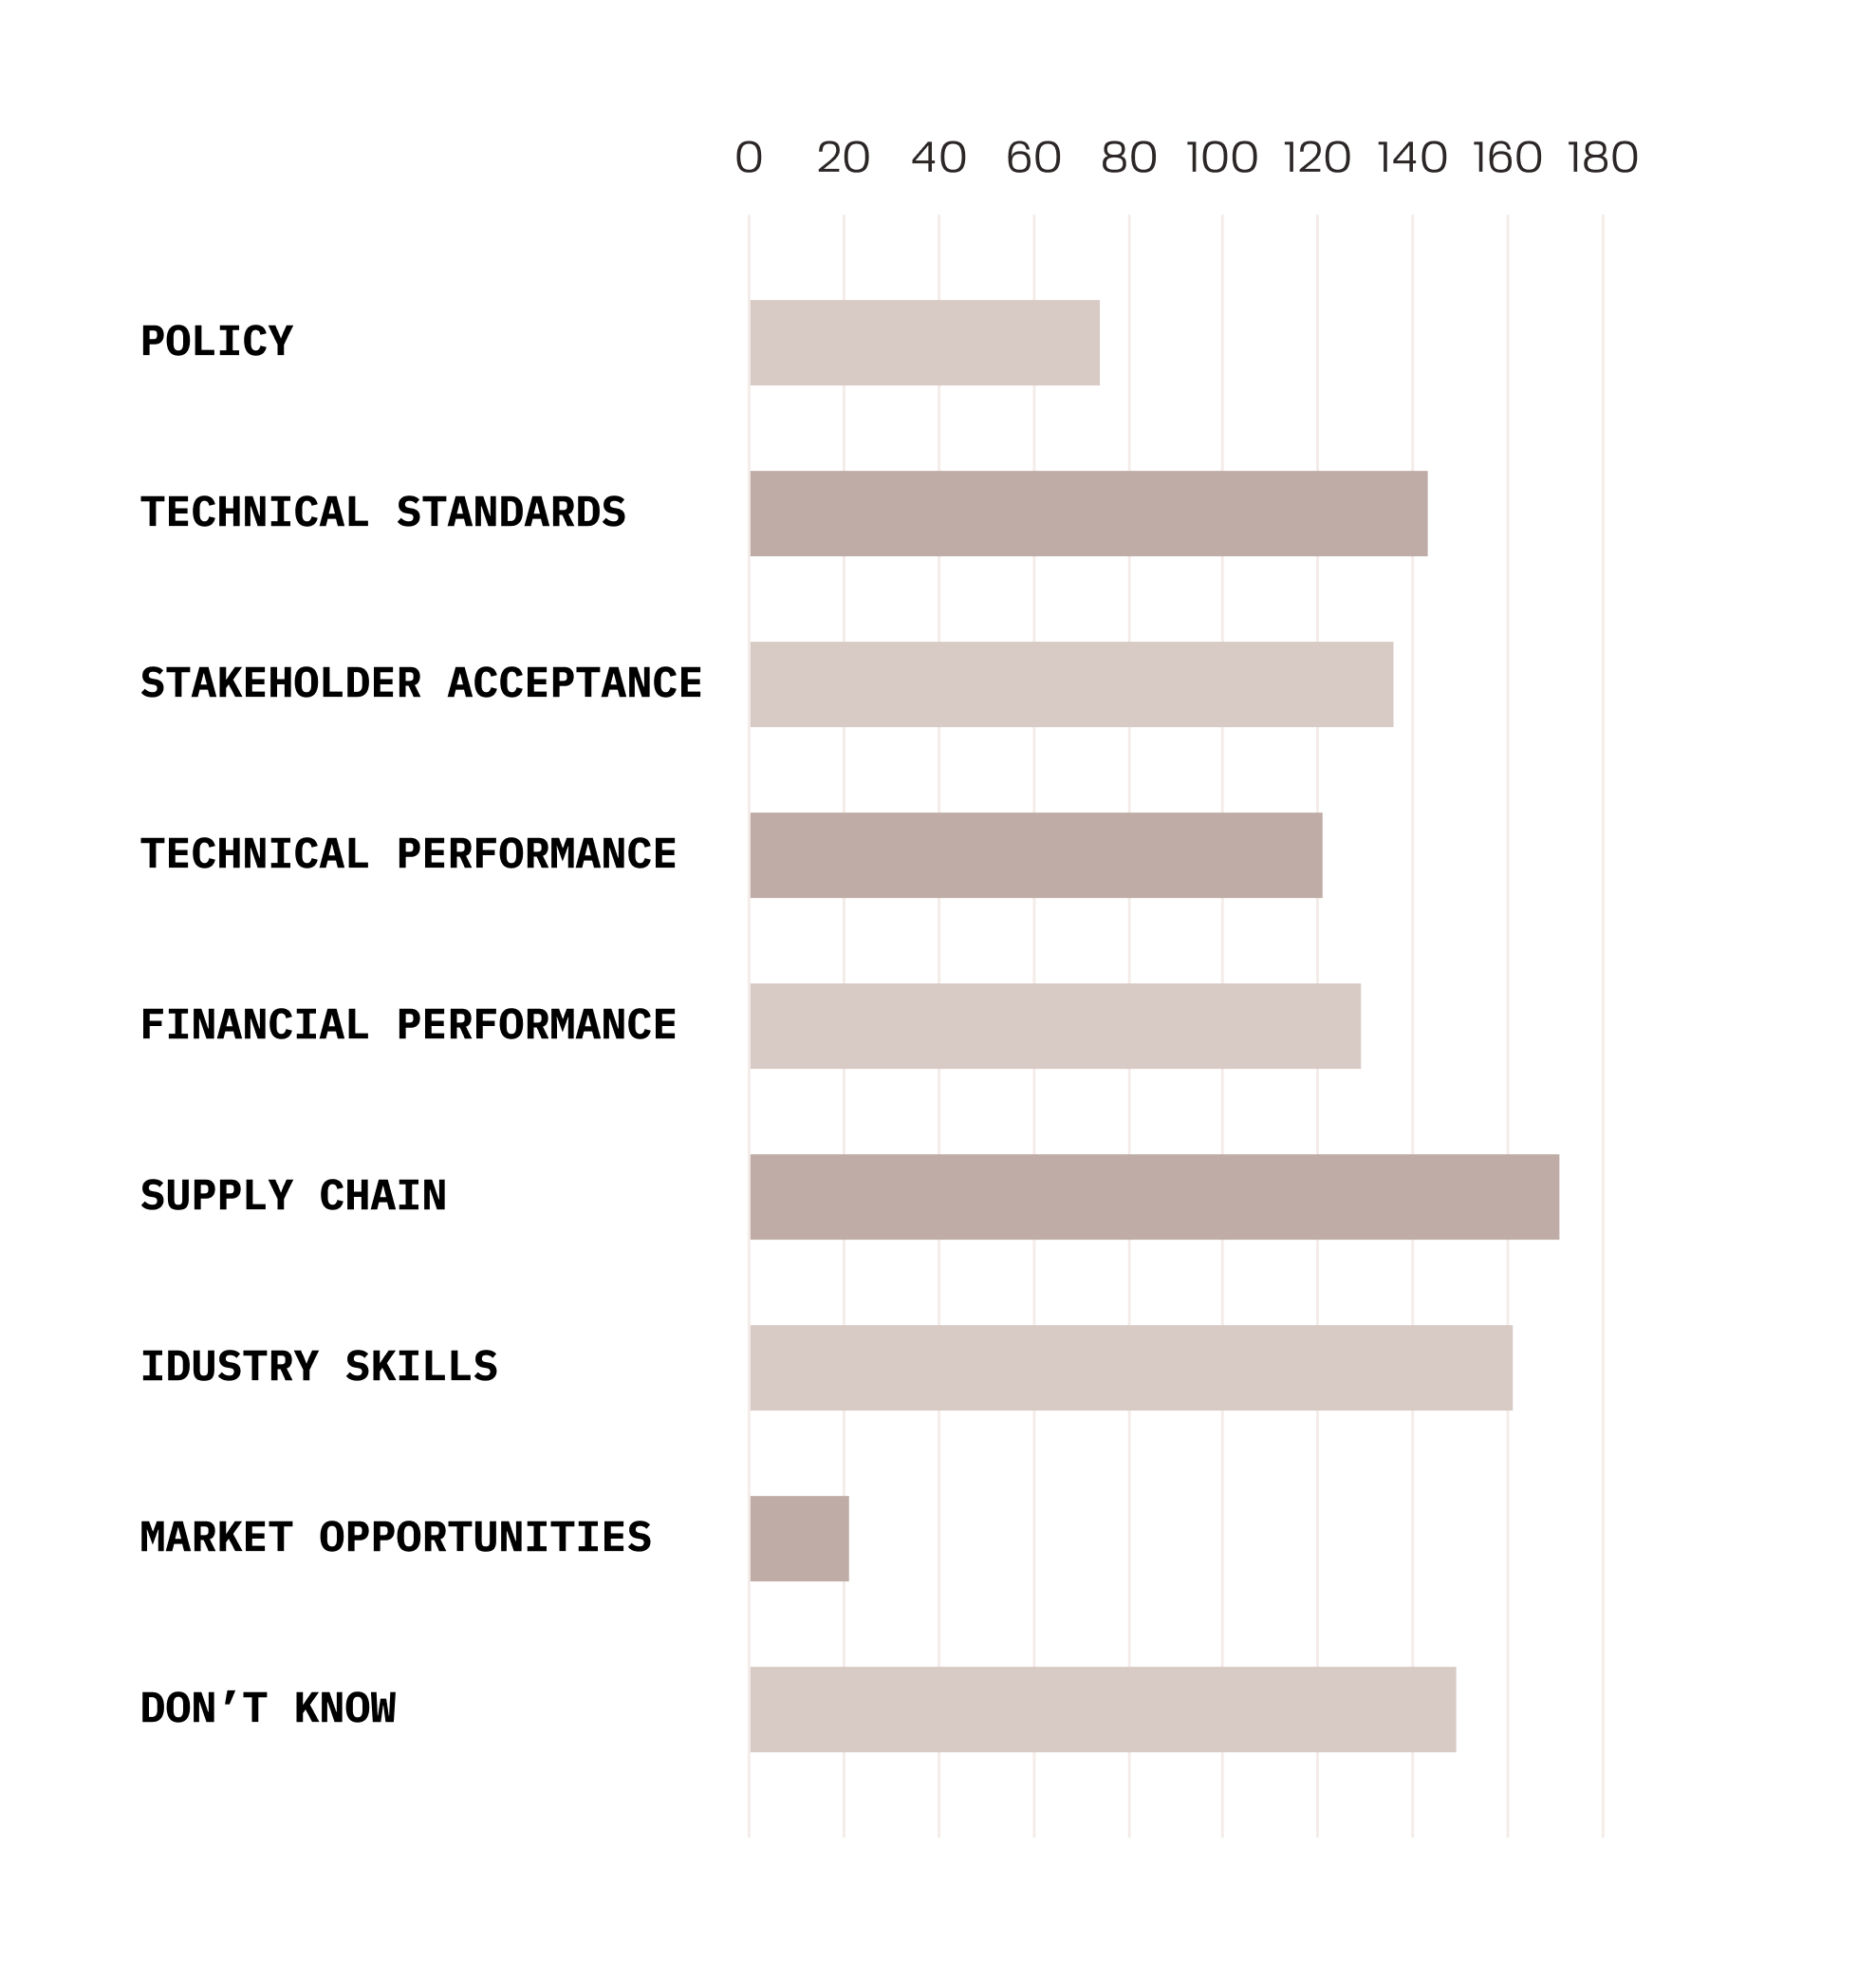
Figure 9: Survey Barrier Frequencies
Priorities and Opportunities for deploying LCCT in the UK
High-Readiness Technologies
The analysis of LCCTs’ potential emissions savings across the lifecycle of cementitious products has shown the following to be the top 10 LCCTs, based on their potential industry savings being over 25%. Each technology’s upper bound individual potential savings (i.e., compared to an OPC baseline), PT, and the CRI summary level are also indicated.
- OxyFuel Carbon Capture (PT 73%, CRI 2)
- Direct Separation Carbon Capture (PT 51%, CRI 3)
- AAMs (non-PFA/GGBS) (PT 45%, CRI 3)
- Calcined Clay SCM (PT 36%, CRI 3)
- MOMS (PT33%, CRI 2)
- Biocements (PT 33%, CRI 2)
- Structural Efficiency (PT 31%, CRI 5)
- Hydrogen as Fuel (PT 27%, CRI 2)
- Post Combustion Carbon Capture (PT 24%, CRI 3)
- Existing Mixes – (PT 24%, CRI 5)
While this illustrates which technologies individual organisations may wish to pursue, potential savings of all technologies are not additive as several of the technologies could not be fully deployed simultaneously. For example, the industry cannot fully deploy both OxyFuel and Direct Separation carbon capture. However, it is possible to ascertain certain combinations of technologies which are additive or complementary and could be pursued to reach deep decarbonisation of the sector.
Technology combinations
To understand the industry-wide approach to implementation of LCCTs, the technologies must be considered in combinations.
Market-ready combination
This combination applies only technologies that have achieved the highest level of commercial readiness and therefore represents the emissions reduction potential of existing technologies. This combination would include:
- Waste as Fuel – (PT 10%, CRI 6)
- Kiln & Electrical Efficiency – (PT 3%, CRI 6)
- Non-concrete Materials – (PT 15%, CRI 6)
- Local Materials – (PT 2%, CRI 6)
- Admixtures – (PT 19%, CRI 6)
- Pre-cast elements – (PT 6%, CRI 6)
High levels of emissions reduction are possible with minimal technical development but significant behavioural change. The primary barrier to the mainstream implementation of these technologies is regulation through policy, suggesting that LCCT-forward policy could unlock these emissions.
The upper bound combined UK industry emissions reduction potential (i.e., compared to an OPC baseline) of these technologies is 37%. The lower bound (i.e., compared to an average UK mix baseline) is 21%. The difference is because the admixtures technology impacts the material constituents of the concrete, whereas the other technologies impact the amount of concrete or the production emissions of OPC. This clearly shows that significant emissions reductions in the AEC sector can be implemented almost immediately.
Maximum-potential combination
An alternative approach would be to create a combination of the highest-potential mutually exclusive technologies, regardless of their CRI. The following technologies are included:
- Calcined Clay SCM – (PT 36%, CRI 3)
- Hydrogen as Fuel – (PT 27%, CRI 2)
- Energetically Modified Cements – (PT 24%, CRI 2)
- Biocement – (PT 33%, CRI 2)
- Non-PFA/GGBS AAMs – (PT 45%, CRI 3)
- OxyFuel Carbon Capture – (PT 73%, CRI 2)
- Structural Efficiency – (PT 31%, CRI 5)
- Existing Mixes – (PT 24%, CRI 5)
This high-potential combination has an approximate upper bound UK industry emissions reduction potential of 98% compared to an OPC baseline. The lower bound (compared to a UK average mix baseline) for this combination, at maximum deployment, is 93%, due to the large number of high potential technologies selected here. This combination is comprised of the highest-potential technologies that are mutually deployable but require varying levels of commercial development. As such, this combination will require significant funding and time to be achieved and as such does not present a path of least resistance but of highest possible reward. Due to the low level of commercial readiness of several of these technologies, it is unlikely that the upper bound estimate for emissions reduction could be realised.
Optimised combination
If we take the most commercially ready technology from each mutually exclusive group, the resulting combination includes:
- Fillers – (PT 13%, CRI 5)
- Waste as Fuel – (PT 10%, CRI 6)
- Kiln & Electrical Efficiency – (PT 3%, CRI 6)
- Activation Agents – (PT 9%, CRI 4)
- CCSC – (PT 23%, CRI 3)
- AAMs (non-PFA/GGBS) (PT 45%, CRI 3)
- Post Combustion Carbon Capture – (PT 24%, CRI 3)
- Non-concrete materials – (PT 14%, CRI 6)
- Structural Efficiency – (PT 31%, CRI 5)
- Existing Mixes – (PT 24%, CRI 5)
- Aggregate Grading – (PT 7%, CRI 5)
- Admixtures – (PT 19%, CRI 6)
- Carbon Curing – (PT 17%, CRI 3)
- Pre-cast elements – (PT 4%, CRI 6)
This combination has an approximate combined upper bound UK industry emissions reduction potential of 93% (i.e., compared to an OPC baseline). The lower bound emissions savings for full deployment of this combination is 68% (i.e., compared to a UK average mix baseline). This presents a wide range of LCCTs that can be implemented by a wide range of stakeholders in the AEC industry, resulting in significant savings at full deployment. This opens several avenues to achieve emissions reductions, rather than relying on a singular technology to do most of the work.
Since this high-readiness combination includes all the CRI 6 technologies, it is recommended that this combination of 14 technologies drives the planning of further work to increase the implementation of LCCTs.
The Life-cycle spread of the Optimised combination is shown in figure 10. The largest number of recommended LCCTs fall under the cement production stage. This can be helpful in terms of implementing policy as cement production as an industry in the UK has a relatively small number of producers, with 13 existing cement plants in the UK.
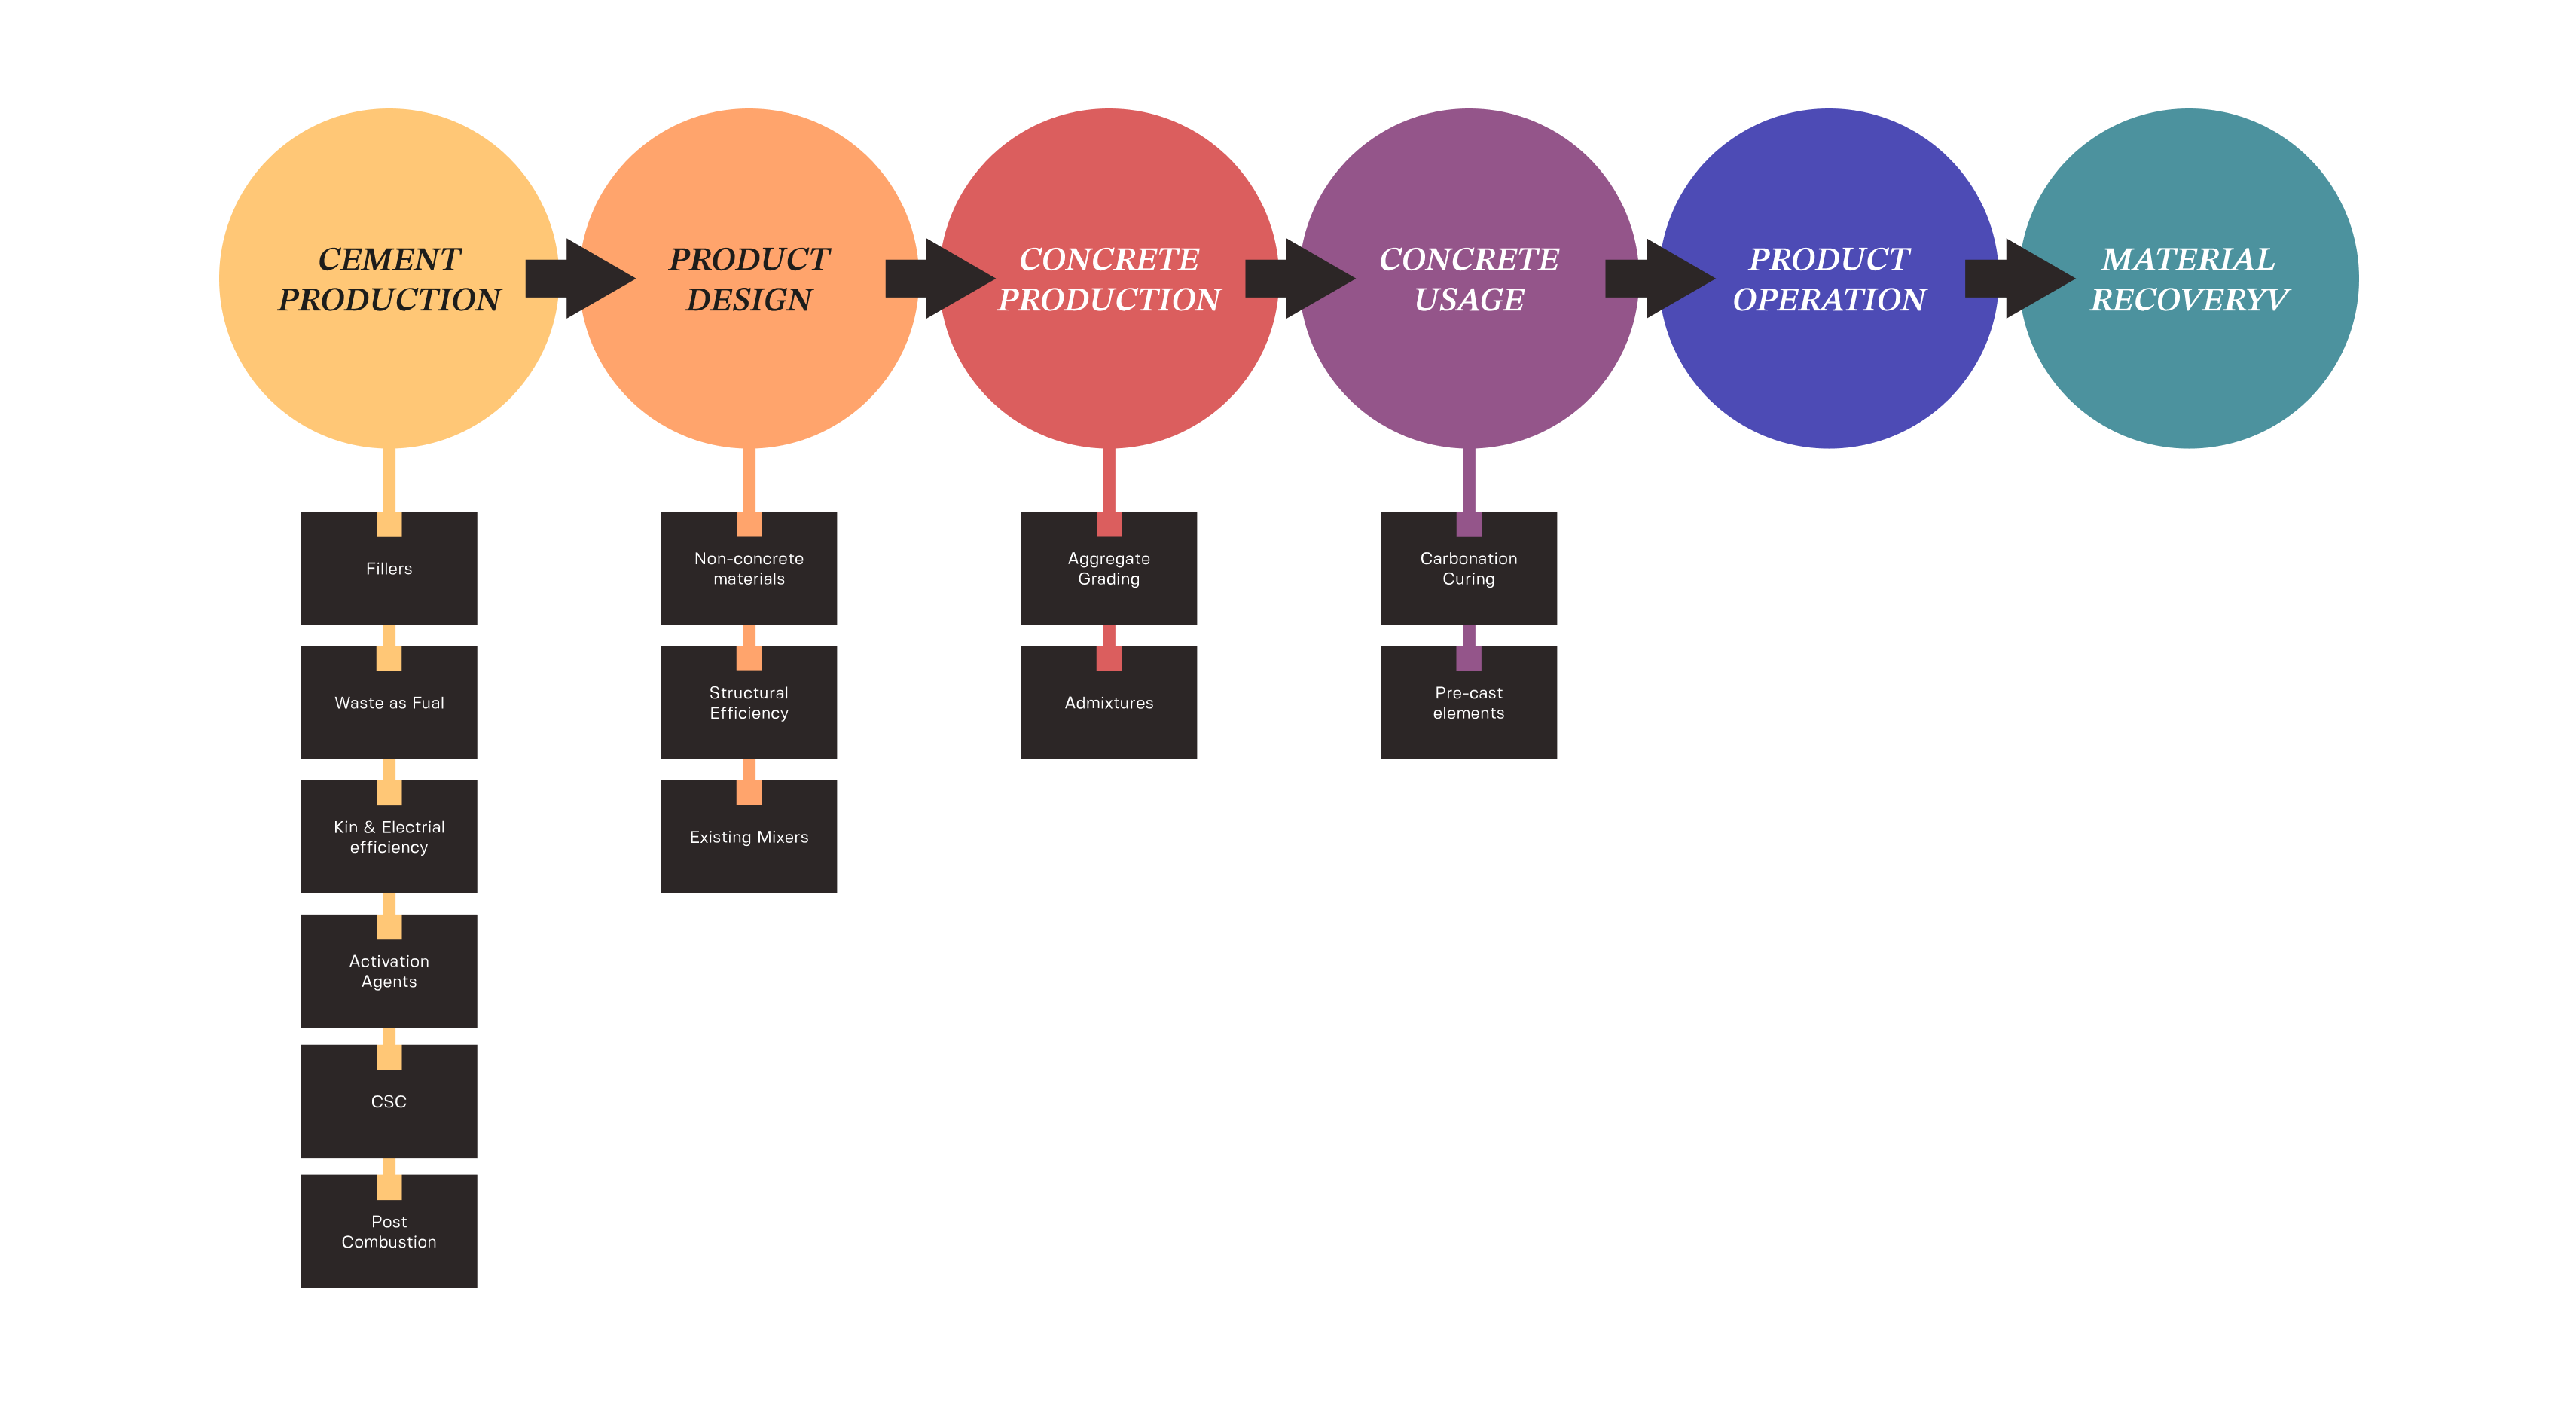
Figure 10: Life-cycle spread of the optimised LCCT Combination
Meet the Authors

Aurelia F. Hibbert
Research assistant

Prof Jonathan M. Cullen
Group Leader & University Professor

Dr Michal P. Drewniok
Postdoctoral research assistant
